Live Streaming from a Notebook
HD Tests
HD Test results are short and sweet; only Kulabyte and Telestream could produce the four stream adaptive project, with Adobe FMLE (which can produce a maximum of three streams) and Expression Encoder, both dropping massive amounts of frames. As mentioned, I tested two files in these tests, a low motion talking head clip and a high-energy blue-grass band rehearsal, and Table 3 presents the CPU utilization results. Both programs get a "pass" in terms of frame rate, with Kulabyte dropping very few frames at the beginning of some clips, and Wirecast producing at least 28.86 fps in all clips, which is certainly adequate for live streaming.
| | Talking Head | High Motion |
Kulabyte XStream 2 | 65-75% | 45-90%. |
Telestream Wirecast | 70-80%, | 150-95% |
Table 3. CPU utilization during four stream adaptive capture.
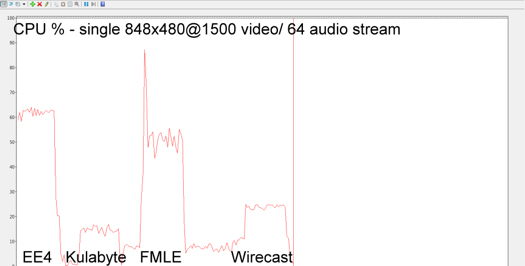
Since a picture is worth a thousand words, I'll present the 848x480 encoding results in Figure 4, showing all four encoders on a single graph. Kulabyte is clearly the most efficient at processing HD video, though Wirecast isn't far behind.

Figure 4. CPU requirements for a single HD stream.
Now you know which programs can produce the streams you want to distribute. Now let's look at how data rate accuracy and stream consistency, because if you can't get the video out of the building smoothly, your experience will suffer dramatically.
Data Rate Accuracy
When you configure the stream for 700Kbps, you want the encoder to hit that target; otherwise, you'll have trouble streaming to the server over a constrained connection, or your viewers may have problems retrieving it. This test is simple-after producing the files I determined the data rate in either MediaInfo or the Bitrate Viewer-and the results are shown in Table 4.
Target data rates | 700Kbps | 400Kbps | 200Kbps | 1500Kbps |
FMLE | 701Kbps | 401Kbps | 199Kbps | 1498Kbps |
Kulabyte | 698Kbps | 398Kbps | 197Kbps | 1499Kbps |
EE4 | 692Kbps | 396Kbps | 193Kbps | 1145Kbps |
Wirecast | 700Kbps | 401Kbps | 200Kbps | 1504Kbps |
Table 4. All encoders were remarkably accurate, with one blip.
Overall, the encoders were remarkably accurate, with one blip on the HD encoding by EE4, which I tested twice and got the same result. This seemed like an anomaly, since all other files captured by EE4 were much closer to the target. Still, if you're producing an HD high-motion live event with EE4, you should run some data rate accuracy tests of your own before the event.
Stream Consistency
By stream consistency, I mean how close to the target data rate the encoded file stayed over the life of the file, which is critical when streaming from or to bandwidth-restricted scenarios. For example, the last live broadcast I produced (with the MacBook Pro and Wirecast) was from a church connecting to the Internet via DSL with a maximum upload speed of around 800Kbps, and I was connecting wirelessly to their router. I targeted a 432Kbps combined audio/video bitrate to be conservative, but if the actual bitrate strayed above 800Kbps for a few moments, it could result in dead air at the receiving end. The same could be true if a viewer is connecting to your live broadcast via a constrained connection, like a 3G or even 4G smartphone.
For this review, I had hoped to use Inlet Semphore to analyze the files, since it presents a highly configurable data rate graph of encoded files. However, Semaphore couldn't read the .ismv files produced by Expression Encoder 4, or the raw output from the Adobe FMLE. Fortunately, I found a program called Bitrate Viewer that could load and display a data rate graph of all files, albeit in a much smaller and less flexible format.
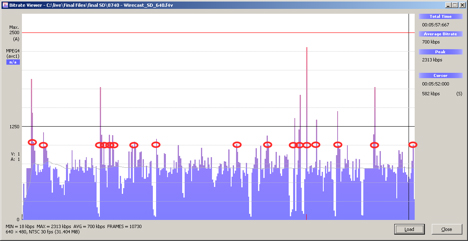
As you see in Figure 5, Bitrate Viewer breaks the file into samples of time, each a vertical slice representing one second. The faint blue wavy line in the midst of the slices, right around 700Kbps, is the floating average data rate. From there, you can see level markers at 1250 and 2500Kbps, with fainter markers in between.

Figure 5. The bitrate viewer showing how often Wirecast's data rate output exceeded 1000Kbps.
The spikes that you see are samples of time where the data rate greatly exceeded the moving average, and you can see small red circles around each data rate spike that exceeded 1Mbps, about 42% higher than the target 700Kbps. Clearly, each spike won't cause a service interruption, but the number of spikes, and their duration is a measure of how closely each stream hugs the target data rate.
Specifically, in Figure 6, Wirecast exceeded the 1Mbps line 17 times, but several of the ticks were for two samples-if you compare the first and second blips on the left, you can see that the first was for two samples, the second for a single sample. So, for the three SD test files, I counted the number of times the data rate exceeded 1 mbps for the 640x480@700Kbps target, 600Kbps for the 480x360@400Kbps target file and 300Kbps for the 320x240@200Kbps file, and the total number of slices that exceeded these levels. I also counted the total number of spikes that exceeded three samples (or three seconds) under the assumption that these would be most likely to interrupt video playback.
SD File | Peaks | Total samples | Peaks with 3 or more samples |
FMLE | 28 | 30 | 0 |
Kulabyte | 28 | 41 | 5 |
EE4 | 19 | 32 | 4 |
Wirecast | 35 | 60 | 7 |
Table 5. Measuring the data rate consistency of the SD streaming files.
Table 5 contains the results. From these, it appears that FMLE does the best job producing a consistent stream that will leave the building smoothly, with the fewest total samples and no peaks of three seconds or longer. EE4 seems to produce the next most consistent stream, followed by Kulabyte with Wirecast at the back in terms of total samples and total peaks of three or more samples.